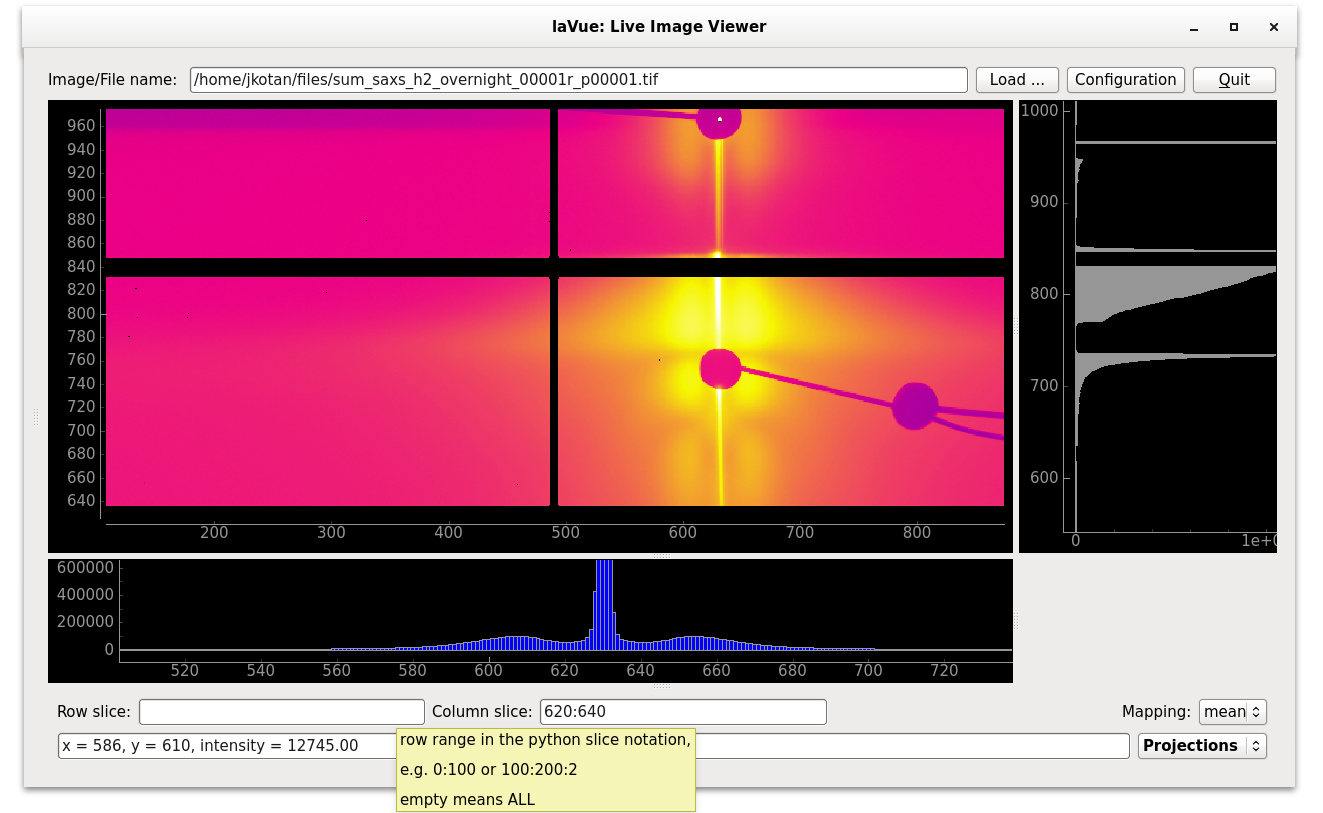
Projections Tool
Projections Tool plots horizontal and vertical projections of the current image

Row/Column slice e.g. 9:10 or 100:120:2, <empty> for all
Mapping: mean or sum
Pixel intensity pointed by mouse and its position
The configuration of the tool can be set with a JSON dictionary passed in the --tool-configuration option in command line or a toolconfig variable of LavueController.LavueState with the following keys:
mapping (sum or mean string), rows (string with a python slice), columns (string with a python slice)
e.g.
lavue -u projections -s test --tool-configuration \{\"mapping\":\"sum\",\"rows\":\"10:200:5\",\"columns\":\"50:150\"\} --start
A JSON dictionary with the tool results is passed to the LavueController or/and to user functions plugins. It contains the following keys:
tool : “projections”, imagename (string), timestamp (float), xx ([float, .., float]), sx ([float, .., float]), yy ([float, .., float]), sy ([float, .., float]), xscale (float), xslice ([float, float, float]), yscale (float), yslice ([float, float, float]), fun (str) [i.e. “mean” or “sum”]